A Tech enthusiast with highly motivated skills || Dedicated and hardworking with a passion for Data Science and Machine Learning || Senior year undergraduate student || Codes in Python & R.
Actively Looking for full-time opportunities in Data Science & Machine Learning
| B.Tech in Electronics and Communication Engineering GURU TEGH BAHADUR INSTITUTE OF TECHNOLOGY (GGSIPU) |
2017-2021 CGPA: 8.1 |
| Higher Secondary School Certificate SS MOTA SINGH SR. SEC. MODEL SCHOOL |
2016-2017 Percentage: 79% |
| Secondary School Certificate SS MOTA SINGH SR. SEC. MODEL SCHOOL |
2014-2015 CGPA: 8.6 |
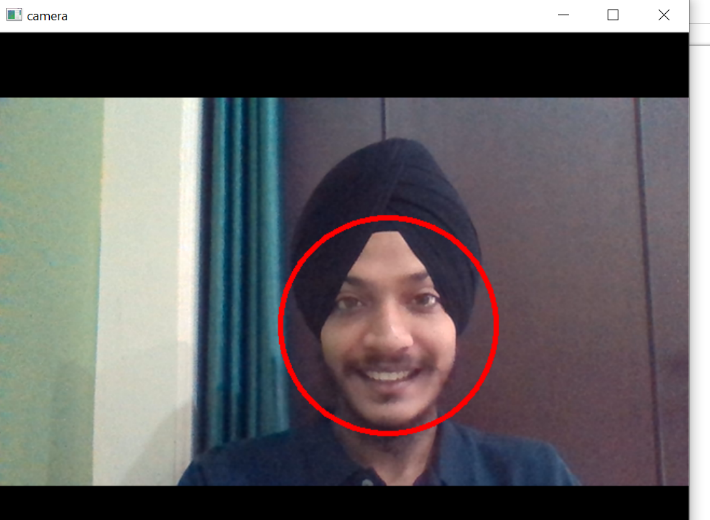
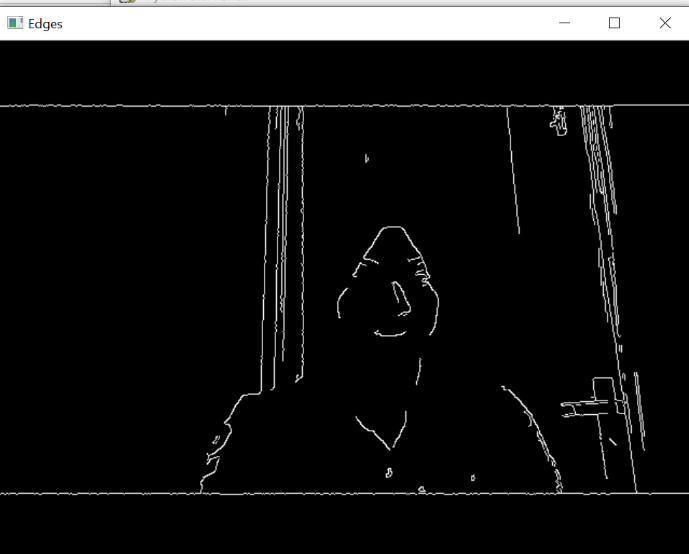
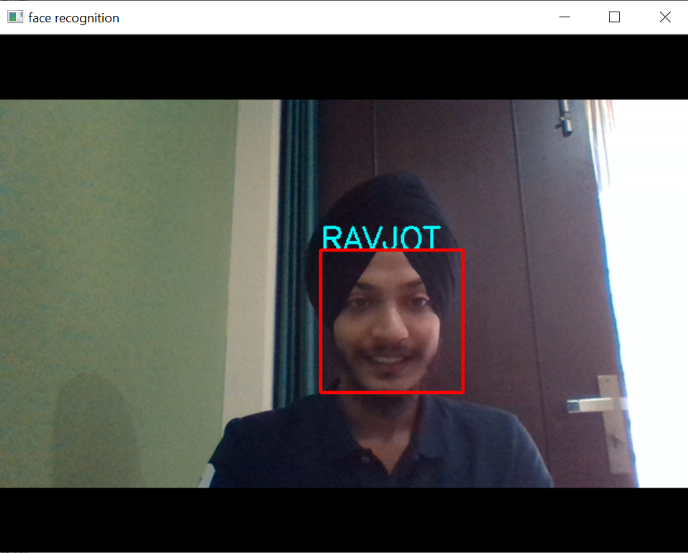
| Statistical Programming Languages | Python (Numpy, Pandas, SciPy, Scikit-Learn, Tensorflow, Keras, Scrapy, Requests, OpenCV, PyTorch, Selenium, BeautifulSoup); R (Dplyr, Rvest, Plyr) |
| Database Management Systems | MS SQL Server; MySQL |
| Data Discovery/ Visualization Tools | Python (Matplotlib, Seaborn, Bokeh, Plotly); R(ggplot); Power BI |
| Statistical Concepts | Regression Modeling, Classification, Clustering, Random Forest, K-Nearest Neighbor, Support Vector Machine (SVM), Time Series Forecasting |
Data Scientist with Python
Applied Data Science with Python Specialization
Artificial Intelligence & Machine Learning
Apart from my on-campus classes, here are my workplace experiences...
Analyst, Data Science
May'2020 - August'2020
Machine Learning Intern
April'2020 - June'2020
Summer Research Intern
May'2019 - July'2019
Active contributor and Author on "The Startup", "Analytics Vidhya" and "Becoming Human : Artificial Intelligence Magazine" top pages.
Posted 2 months ago
Visualizing statistical relationships - Statistical analysis is a process of understanding how variables in a dataset relate to each other and how those relationships depend on other variables. Visualization can be a core component of this process because, when data are visualized properly, the human visual system can see trends and patterns that indicate a relationship.
Posted 1 month ago
Seaborn is a wonderful visualization library provided by python. It has several kinds of plots through which it provides the amazing visualization capabilities. Some of them include count plot, scatter plot, pair plots, regression plots, matrix plots and much more. This article deals with the regression plots and matrix plots in seaborn.
I'd Love To Hear From You.
EMAIL ME AT
ravjot313@gmail.com
CALL ME AT
+91-9654446404
WHERE TO FIND ME
Delhi, India